Xdebug is an amazing PHP extension which provides debugging and profiling capabilities. Every PHP developer should be familiar with it. However, Xdebug is often not used because of a tricky configuration. In this post I’m troubleshooting a port issue a was facing recently.
Default installation
To install Xdebug I was mostly following the PhpStorm: Configuring Xdebug guide with some small changes to accommodate the fact that I’m running Xdebug in a Docker container.
My loaded .ini file configuration for Xdebug is looking like this:
1[Xdebug]
2xdebug.default_enable=1
3xdebug.remote_enable=1
4xdebug.remote_port=9000
5xdebug.idekey=PHPSTORM
6xdebug.remote_host=host.docker.internal
The host.docker.internal is a special DNS name available in Docker version 18.03 onward and it’s recommended
way of connecting to the host from a container.
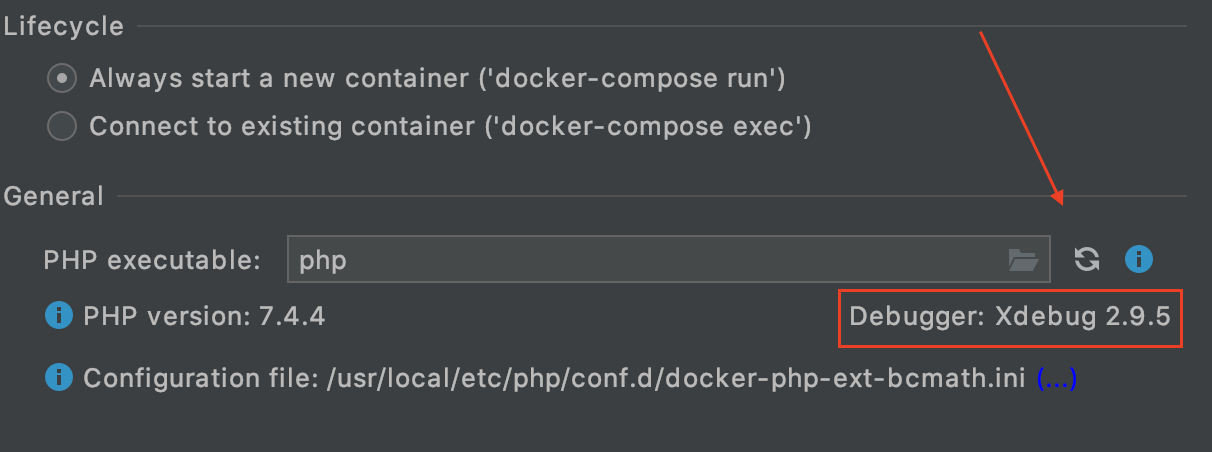
Once the Xdebug was installed, I’ve verified the installation in a CLI interpreter tab.

And in the actual container as well:
1$ docker exec my_app php -v
2PHP 7.4.4 (cli) (built: Mar 24 2020 01:34:16) ( NTS )
3Copyright (c) The PHP Group
4Zend Engine v3.4.0, Copyright (c) Zend Technologies
5    with Zend OPcache v7.4.4, Copyright (c), by Zend Technologies
6    with Xdebug v2.9.5, Copyright (c) 2002-2020, by Derick Rethans
Xdebug is enabled in PhpStorm settings and it’s using the default port 9000. With the configuration above, the IDE should be able to accept PHP debug connections.

However, when I try to initiate a debug session nothing happens.
Troubleshooting
I’m using static IP address communication set-up as the xdebug.remote_host configuration option is used.
When the IDE is listening to a connection, then I’m expecting port 9000 to be open.
This can be verified with Netcat command line utility (nc) within the Docker container:
1$ docker exec my_app nc -zv host.docker.internal 9000
2host.docker.internal (192.168.65.2:9000) open
It looks like the IDE is listening as expected.
Next, I’m going to confirm that the port 9000 is not open when I Stop Listening for PHP Debug Connections:
1$ docker exec my_app nc -zv host.docker.internal 9000
2host.docker.internal (192.168.65.2:9000) open
However, it’s not the case. The open port is not the expected behaviour. When I list open ports on my host machine I can see which service listens on the port 9000:
1$ sudo lsof -PiTCP -sTCP:LISTEN | grep 9000
2php-fpm   27508   lukas    8u  IPv4 0x21ff62ff0f11e045      0t0  TCP localhost:9000 (LISTEN)
3php-fpm   27527   lukas    9u  IPv4 0x21ff62ff0f11e045      0t0  TCP localhost:9000 (LISTEN)
4php-fpm   27528   lukas    9u  IPv4 0x21ff62ff0f11e045      0t0  TCP localhost:9000 (LISTEN)
Initially, I didn’t realise that I have php-fpm running locally. Once I stop the running php service
and I run the previous nc command I can see no response. This means the port is not open anymore as expected:
1$ brew services stop php
2Stopping `php`... (might take a while)
3==> Successfully stopped `php` (label: homebrew.mxcl.php)
4
5$ docker exec my_app nc -zv host.docker.internal 9000
6// no response
If I Start Listening for PHP Debug Connections and I run the nc, I should see the port 9000 open again.
This verifies that the IDE is finally in charge of the port.
When I try to initiate a debug session this time I can finally see Xdebug connection in my IDE.
Conclusions
Tricky configuration should not discourage us from using Xdebug as it can be extremely helpful at debugging. This article should help you to understand some of the issues and the way to troubleshoot them.
comments powered by Disqus